Price as the solution of the demand/supply mechanism reflects the dreams, expectations, guesses, hopes, moods and nightmares of all investors trading in the market. A true chartist does not even care to know which business or industry a firm is in, as long he can study its stock chart and knows its ticker symbol. The motto of Doyne Farmer's prediction company as quoted by Bass, 1999, p.102, was for example: ``If the market makes numbers out of information, one should be able to reverse the process and get information out of numbers.'' The philosophy behind technical analysis is that information is gradually discounted in the price of an asset. Except for a crash once in a while there is no `big bang' price movement that immediately discounts all available information. It is said that price gradually moves to new highs or new lows and that trading volume goes with the prevailing trend. Therefore most popular technical trading rules are trend following techniques such as moving averages and filters. Technical analysis tries to detect changes in investors' sentiments in an early stage and tries to profit from them. It is said that these changes in sentiments cause certain patterns to occur repeatedly in the price charts, because people react the same in equal circumstances. A lot of `subjective' pattern recognition techniques are therefore described in the technical analysis literature which have fancy names, such as head & shoulders, double top, double bottoms, triangles, rectangles, etc., which should be traded on after their pattern is completed.
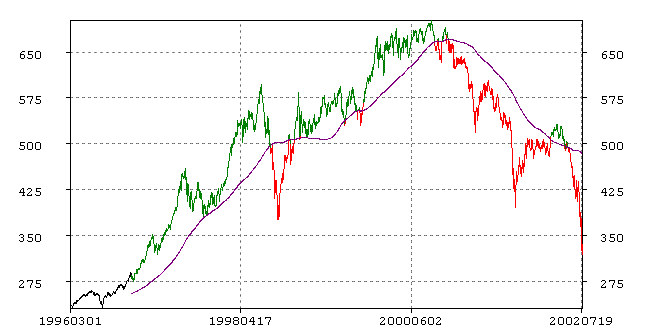
An example: the moving-average technical trading rule.
At this point it is useful to illustrate technical trading by a simple example. One of the
Figure 1.1: A 200-day moving-average trading rule applied to the AEX-index in the period March 1, 1996 through July 25, 2002.